This field activity revolves around the creation of a field navigation map in preparation for another navigation activity taking place later in the semester. By using a given Priory Area, two maps are to be created. The first uses a UTM projection, and the second uses a geographic coordinate system with decimal degrees.
Methods
UTM Map
For the UTM map, use a measured grid. A good interval for the grid is 50 meters. Make the primary font size 8 and black, and the secondary font size 5 and grey. Make sure to make the grid line black so it is easier to see.
 |
| Figure 1 |
To make the contour lines more legible, use the contour spatial analysis tool. To switch the contour interval from 2 feet to 5 or 10 feet. This map will use 5 feet intervals.
 |
| Figure 2 displays the contour (spatial analysis) tool window |
To make things even less messy one can simply clip all contour lines within the study area. To do this search for clip input the contour line feature class, then drag Navigation boundaries in for clip features, and name the output feature class whatever you.
 |
| Figure 3 shows the Clip tool window |
Decimal Degrees Map
The second map needs to be in Decimal Degrees. Use a graticule grid for this map.
 |
| Figure 4 shows the Grids selection window |
Switch the intervals for parallels and meridians to 2 seconds.
 |
| Figure 5 shows the create a graticle window. |
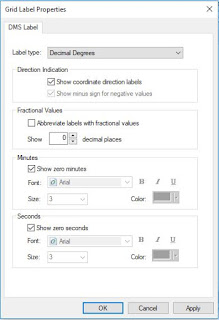
Go into the Grid Label Properties and switch the label type to Decimal Degrees, then under Fraction values, click the check box and choose 3-4 decimal places.
 |
| Figure 6 shows the Grid Label Properties |
Results/Discussion
The Navigation maps developed in this assignment use the same given boundary and Digital elevation models. The two created in this assignment use UTM and Decimal degree grids. Both use elevation contours, with 5 feet intervals which spaces things out and makes the map easier to interpret. It goes to show that although maps may vary with different techniques and features, a nearly identical outcome can still be achieved.
UTM Map:
 |
| Figure 7 displays the UTM grid map. |
Decimal Degrees Map:
 |
| Figure 8 displays the Decimal Degrees Grid Map |
Sources
Priory Geodatabase, UWEC Geography Department., Dr. Joseph Hupy
No comments:
Post a Comment